Cloudwatch
-
plot_metric(namespace, metric_name, **kwargs)¶ Fetch metric data from Cloudwatch and render it as a graph inside Notebook.
Parameters: - namespace (
str) – The namespace of the metric e.g.AWS/EC2. All Possible values. - metric_name (
str) – Name of the metric e.g.Latency. Here’s a way to list all possible metrics for your namespace. - **kwargs – These are optional. See below.
Keyword Arguments (Optional): - start_time (
datetime.datetime) - Time from which to fetch metrics data. Defaults to (end_time - 12 hours)
- start_time (
- end_time (
datetime.datetime) - Time until which to fetch metrics data. Defaults to current time.
- end_time (
- statistics (
str) - Metric statistics for your graph e.g.
Minimum,Maximum,Sum,Average. All possible values. Deaults toAverage
- statistics (
- markers (
[datetime.datetime]) - Markers to indicate timestamp of significant events e.g. you can fetch deployment times with this method and plot them as markers to see metrics’s corelation with deployment. Any marker not between
start_timeandend_timeis simply ignored. Defaults to [].
- markers (
- dimensions (
dict) - A name/value pair that uniquely identifies a metric. See this and examples below. When not specified all metrics matching the
namespaceandmetric_nameare graphed.
- dimensions (
- aws_access_key_id (
str) - AWS access key of an IAM user to call cloudwatch API. Defaults to environment variable
AWS_ACCESS_KEY_ID. Can be overwritten per method by supplying this keyword argument.
- aws_access_key_id (
- aws_secret_access_key (
str) - AWS secret access key of an IAM user to call cloudwatch API. Defaults to environment variable
AWS_SECRET_ACCESS_KEY. Can be overwritten per method by supplying this keyword argument.
- aws_secret_access_key (
- aws_region (
str) - AWS region for the resource whose metrics you are plotting. Defaults to environment variable
AWS_REGION. Can be overwritten per method by supplying this keyword argument.
- aws_region (
Examples: from rubix.aws.cloudwatch import plot_metric # Load balancer P90 latency with deployment time markers plot_metric(namespace='AWS/ELB', metric_name='Latency', dimensions={'LoadBalancerName': 'prod-xyz-lb'}, markers=deployment_times, statistics='p90') # Maximum CPU Utilization across EC2 for a specific time period plot_metric(namespace='AWS/EC2', metric_name='CPUUtilization', start_time=datetime.datetime(2018, 04, 25), end_time=datetime.datetime(2018, 04, 26) statistics='Maximum')
Sample Usage and Output: 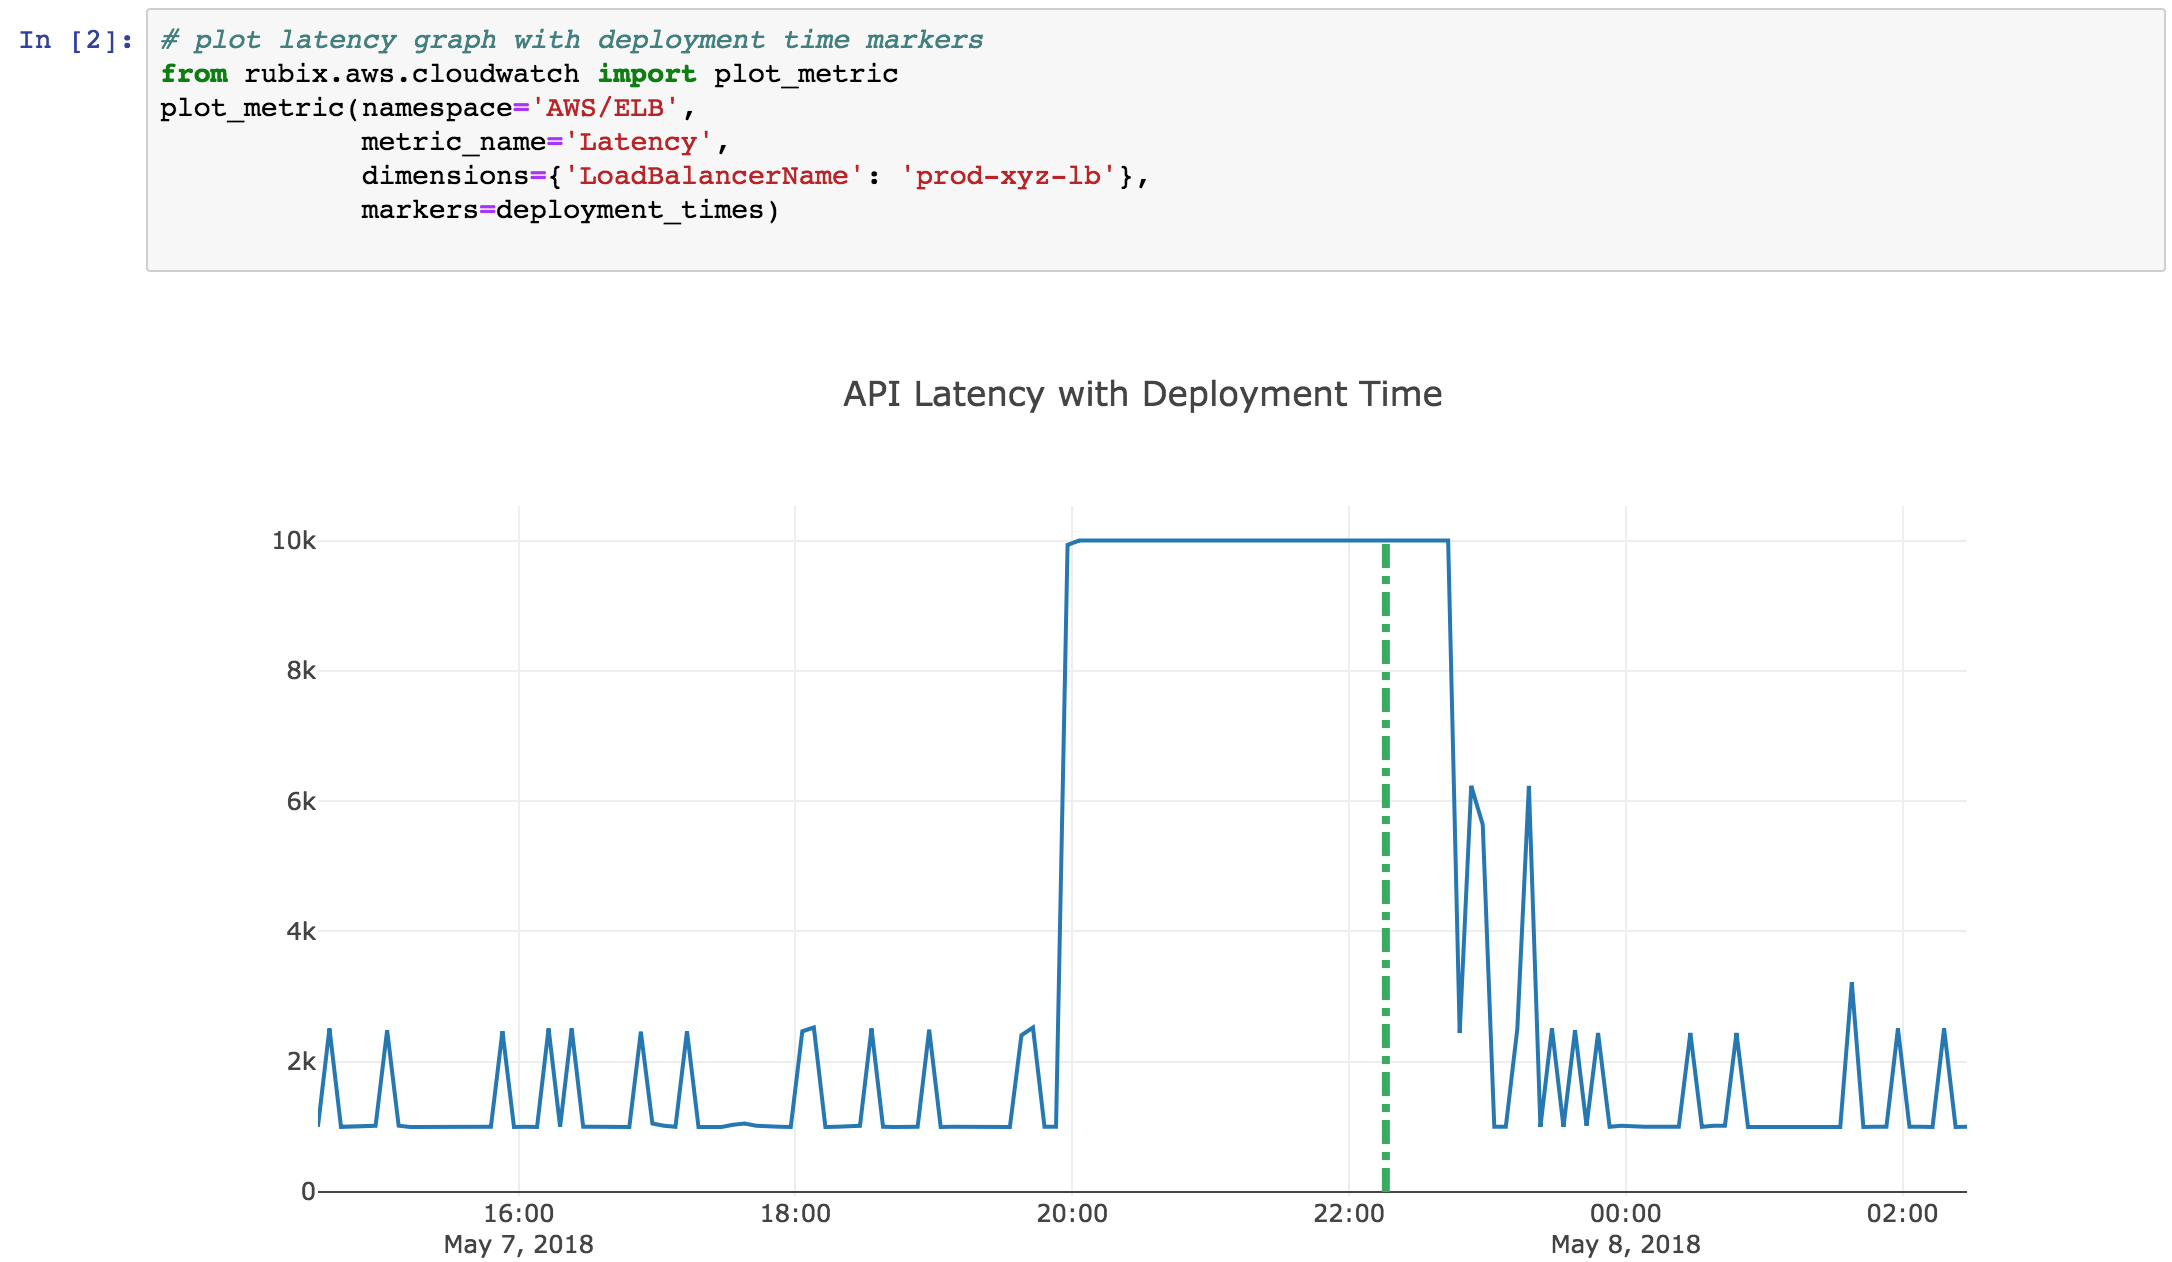
- namespace (